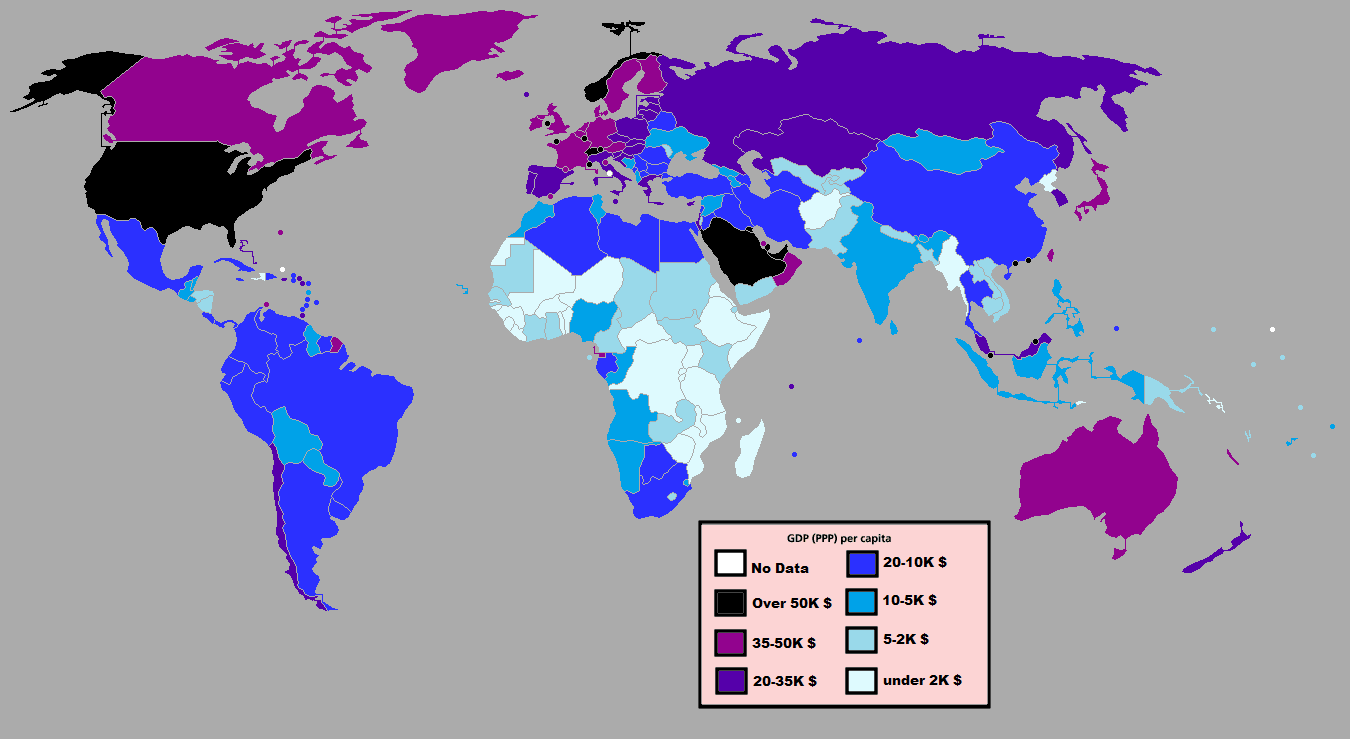
This is a nice series of maps from Vox that explain aspects of the world's economy. Visuals are a great way to show your students what is being studied. For example the image above is the per capita GDP of individual countries. So if you know the ones colored black are the highest and then dark blue, light blue, you can very quickly see the richest areas of the world.
No comments:
Post a Comment